See Previous Example First!
Takeaway from this post: Sencha SDK Tools 1.2.3 are still beta and I don’t advise using them in production. This is a follow up post to my previous examples – I spent some time the other day trying to set up a 1-click build process for ExtJS, and failed!
Custom Build File Size
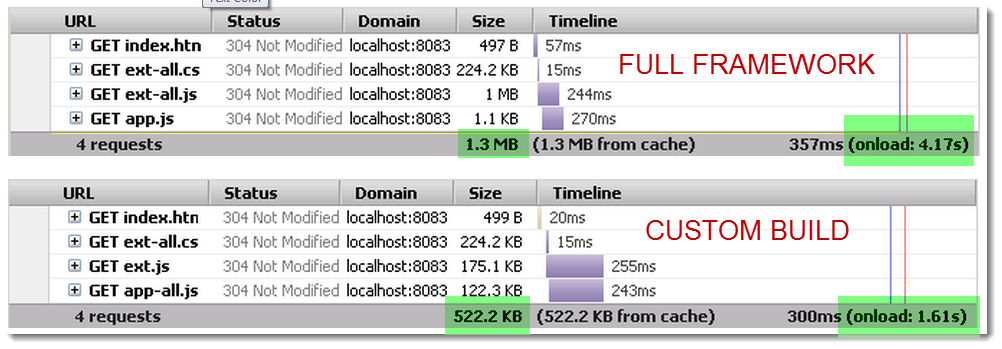
First, let’s talk about the incorrect file size shown on this screenshot in my previous 2 posts:
In the “Custom Build” example, the custom-built app-all.js is shown as being 120KB in size. In reality, the file is about 400KB in size on the disk. I don’t understand why that is – compression? If that was the case, wouldn’t the 1MB ext-all.js in the “Full Framework” example be something closer to 200KB? After some Googling I couldn’t figure out how to tell if a file was compressed. Any advice here is welcome as I’m a bit lost.
sencha create jsb
This is a command line tool from Sencha SDK Tools that will compile a JSON .jsb3 metadata file that will later be consumed by the sencha build command. The purpose of .jsb3 file is to catalog all the .JS files that will be included in the build. In order to do so, the sencha command accepts a parameter that is either a local HTML page or an actual URL, which will then be parsed for ExtJS dependencies. As of version 1.2.3 the sencha create jsb command has the following issues:
- Passing a local HTML file simply does not work – always errors out
- Passing a URL does not work if you have a Windows Authenticated website (ASP.NET developers take note!)
- Paths in .jsb3 will be corrupt unless you do all of the building in the same place as where your app.js lives; there is no straightforward workaround and you don’t always want all the build “garbage” files (at least 3) in the same place as your source base
Production In the Meantime
Now, all these problems could still be worked around through some simple shell scripting, but I would rather wait until they’re resolved in the actual SDK tools. So, what is one to do in the meantime?
Well, in anticipation of Sencha fixing the SDK tools later, I still want to do proper ExtJS class-loader-friendly file structure. However, I don’t want to use loader for the entire framework, since that is too slow in production. So, I settled on a compromise: serve the full ext-all.js, while still enabling loader for any of my custom code!
Default.aspx:
<%-- JS - see js/app.js for entry point --%> <script type="text/javascript" src="extjs/ext-all.js"></script> <script type="text/javascript" src="js/app.js"></script> |
app.js
// Enable loader Ext.Loader.setConfig({enabled: true}); // Since we're using ext-all.js // Entry point for our ExtJS application Ext.application({ name: 'app', appFolder: '/js/app', // rquired for ExtJS loader launch: function() { ... }, requires: // for build script dependencies [ ... ] }); |


Hi Ivan,
Interesting article! Thanks for sharing.
Regarding the custom build file size: The difference in file size between what Firebug reports and what you see on disk is very likely due to file compression on the web server. You can tell if a file has been compressed by looking at the HTTP response header. In Firebug:
– Open the details view of a request
– Go to tab “Headers”
– In section “Response Headers” you will see a header “Content-Encoding gzip” or similar if a file has been compressed.
According to your screen shots, all files have been read from cache (request status is 304 Not modified). It would be interesting to see what the onload performance difference is if the files are not cached.
Gabe
I did the FireBug thing and I saw this in request headers, when seeing 122 KB size:
Accept-Encoding gzip
…and this in the response headers:
Vary Accept-Encoding
By contrast, when I see the full 400KB size, that “Vary” header is not present. Does it mean it got zipped in the cache or something?
For non-cached content it took 15ms. Don’t ask, maybe my machine was feeling slow that other day? By contrast, cached content takes 0ms today 😛